GitHub and Claude Are Down Three Out of Four Days
GitHub's average uptime since September: 91%. Claude's: 80.4%.
146 out of 198 days, at least one of them had an incident.
We've gone fully agentic at Wyndly, my telehealth allergy practice committed to curing everyone's allergies forever. Doctors, care teams, engineers all running agents daily. When these services go down, care decisions slow down.
Maybe your git push went through. Probably.
Six months ago, I'd have migrated immediately. Then I looked at what happened on Christmas, 2025.
198 days. 146 with at least one incident.
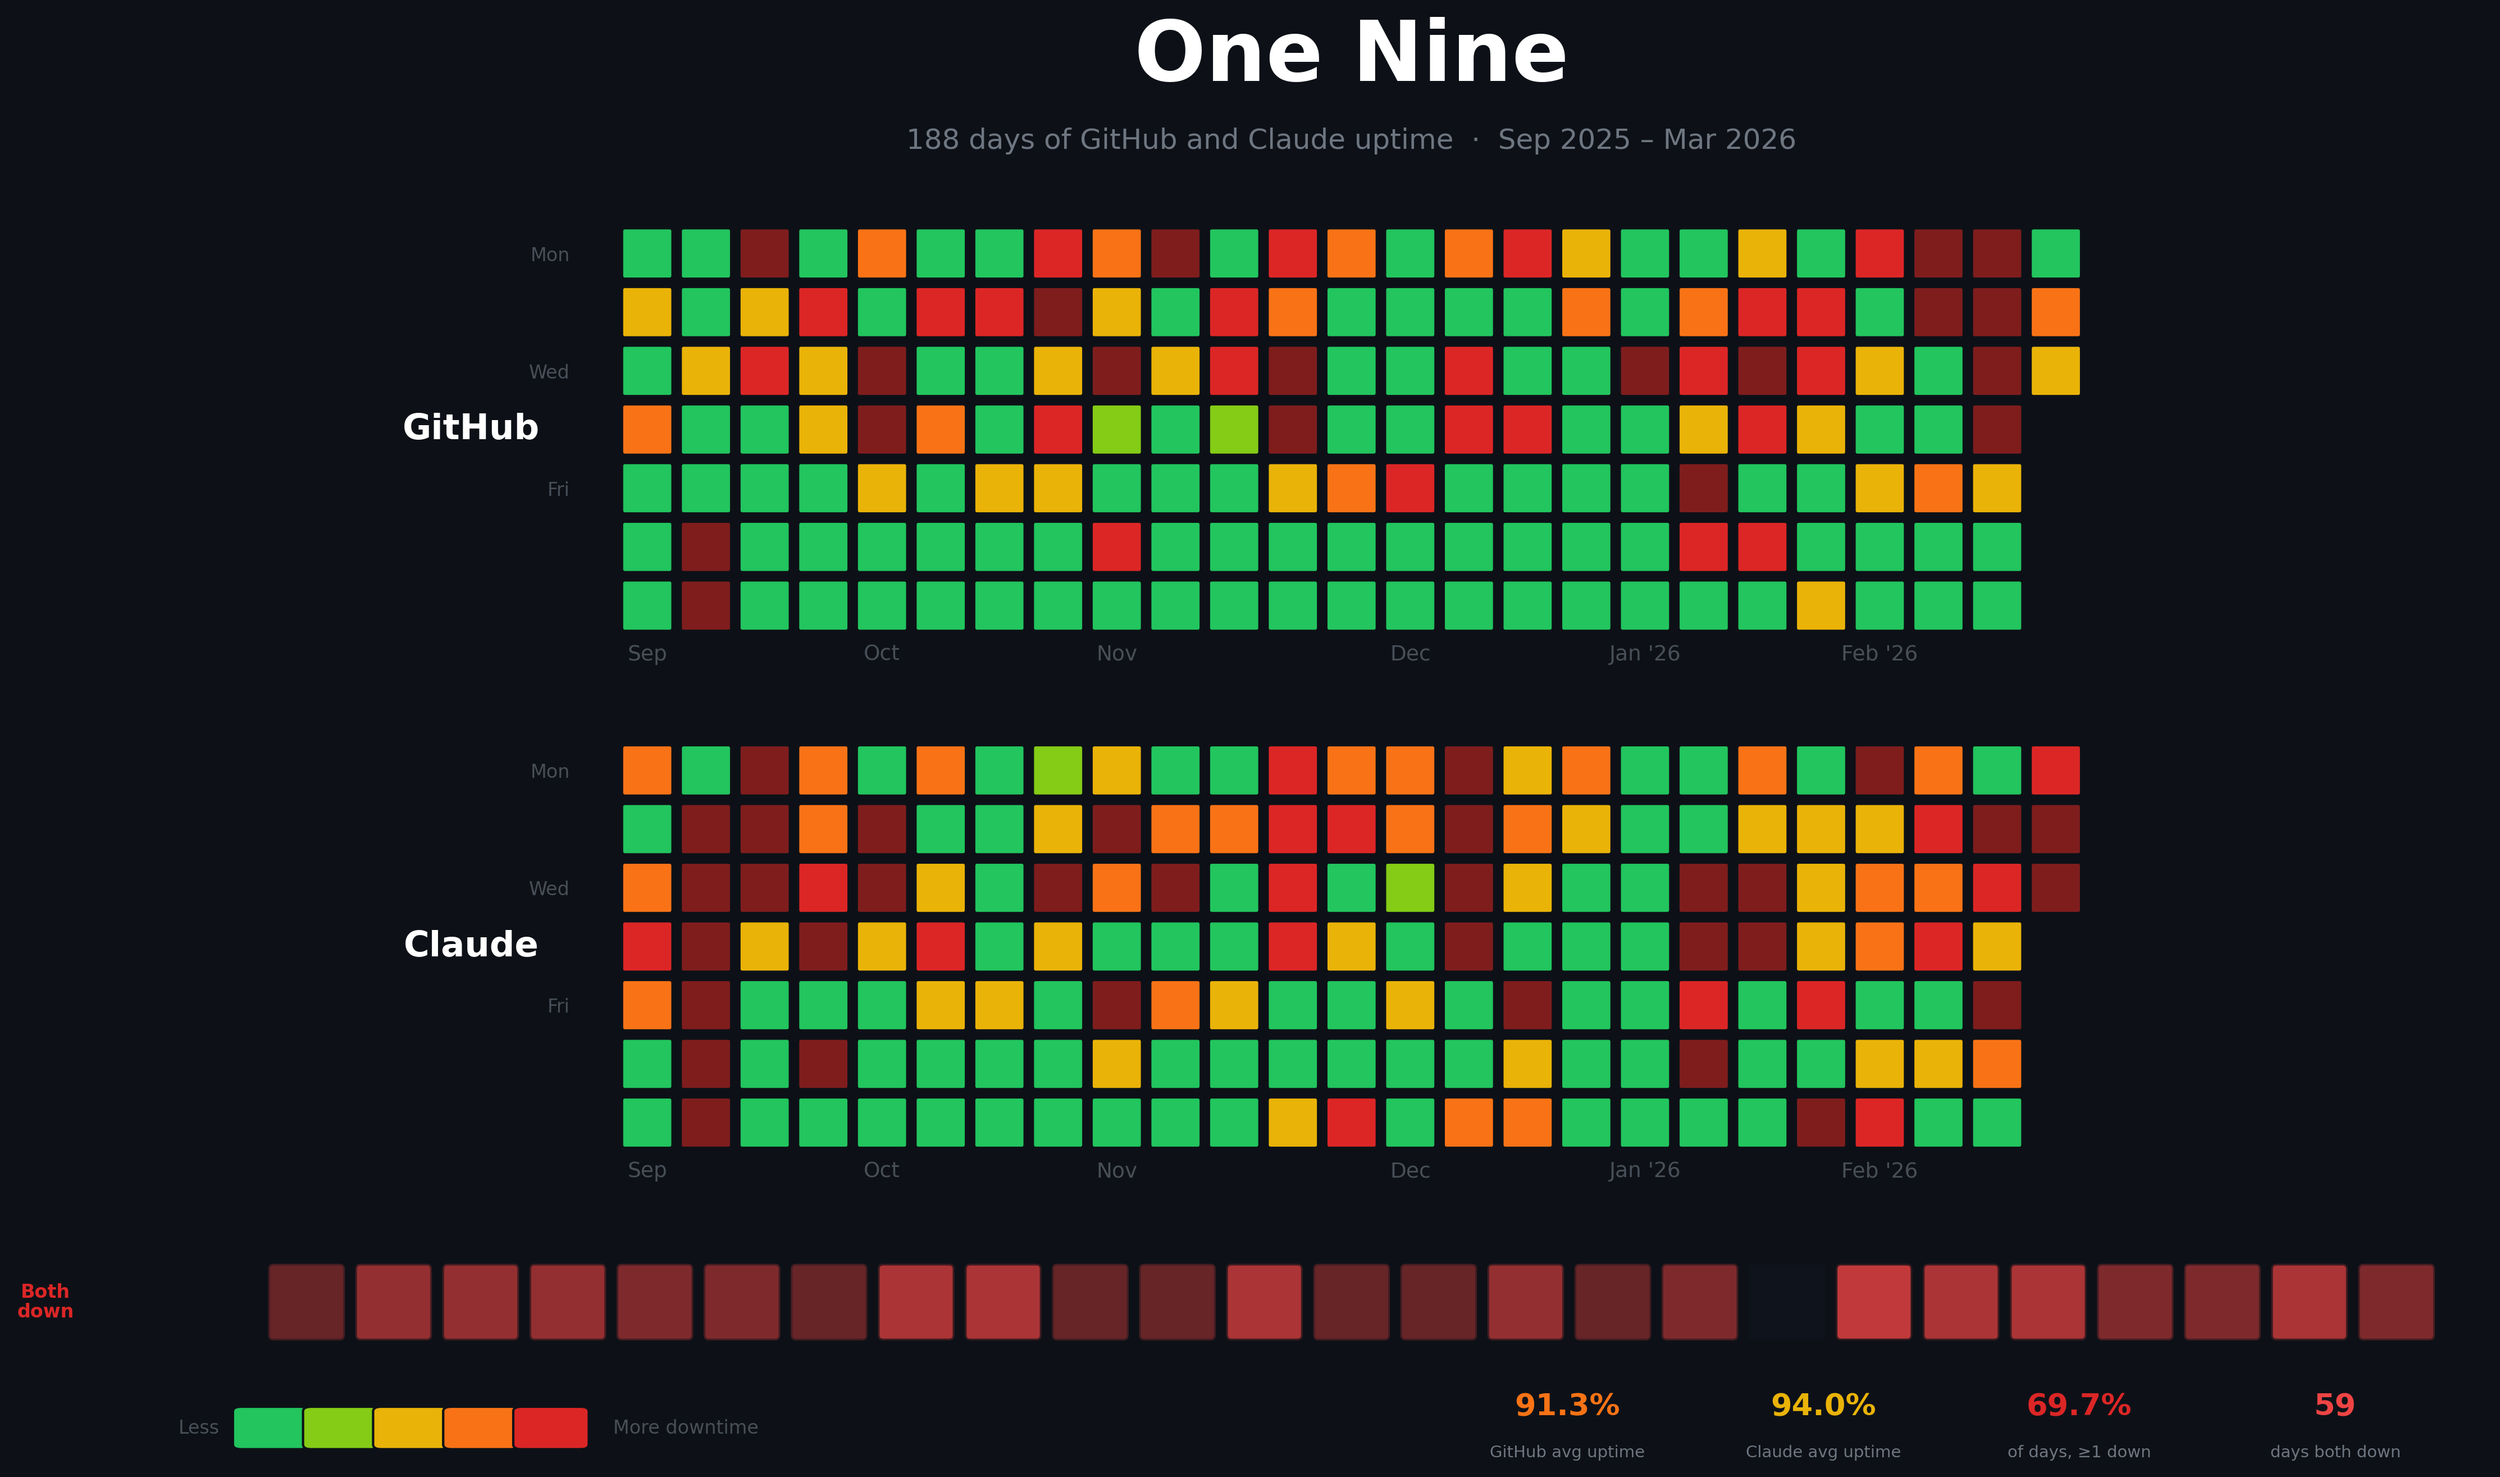
The Heatmap of Hell
The heatmap above should be all green. Instead, it's red, very, very often. Green days are perfect. Red days are bad.
- 146 out of 198 days (73.7%), at least one of these two services had an incident. Three out of every four days.
- 74 days both GitHub and Claude were down simultaneously.
- March 2026 is the worst month on record for Claude at 62.4% average uptime. GitHub is at 87.9%. Both services have been getting worse since December.
GitHub has accumulated 418 hours of total outage time since September, over seventeen full days. Claude has accumulated 934 hours, nearly thirty-nine days.
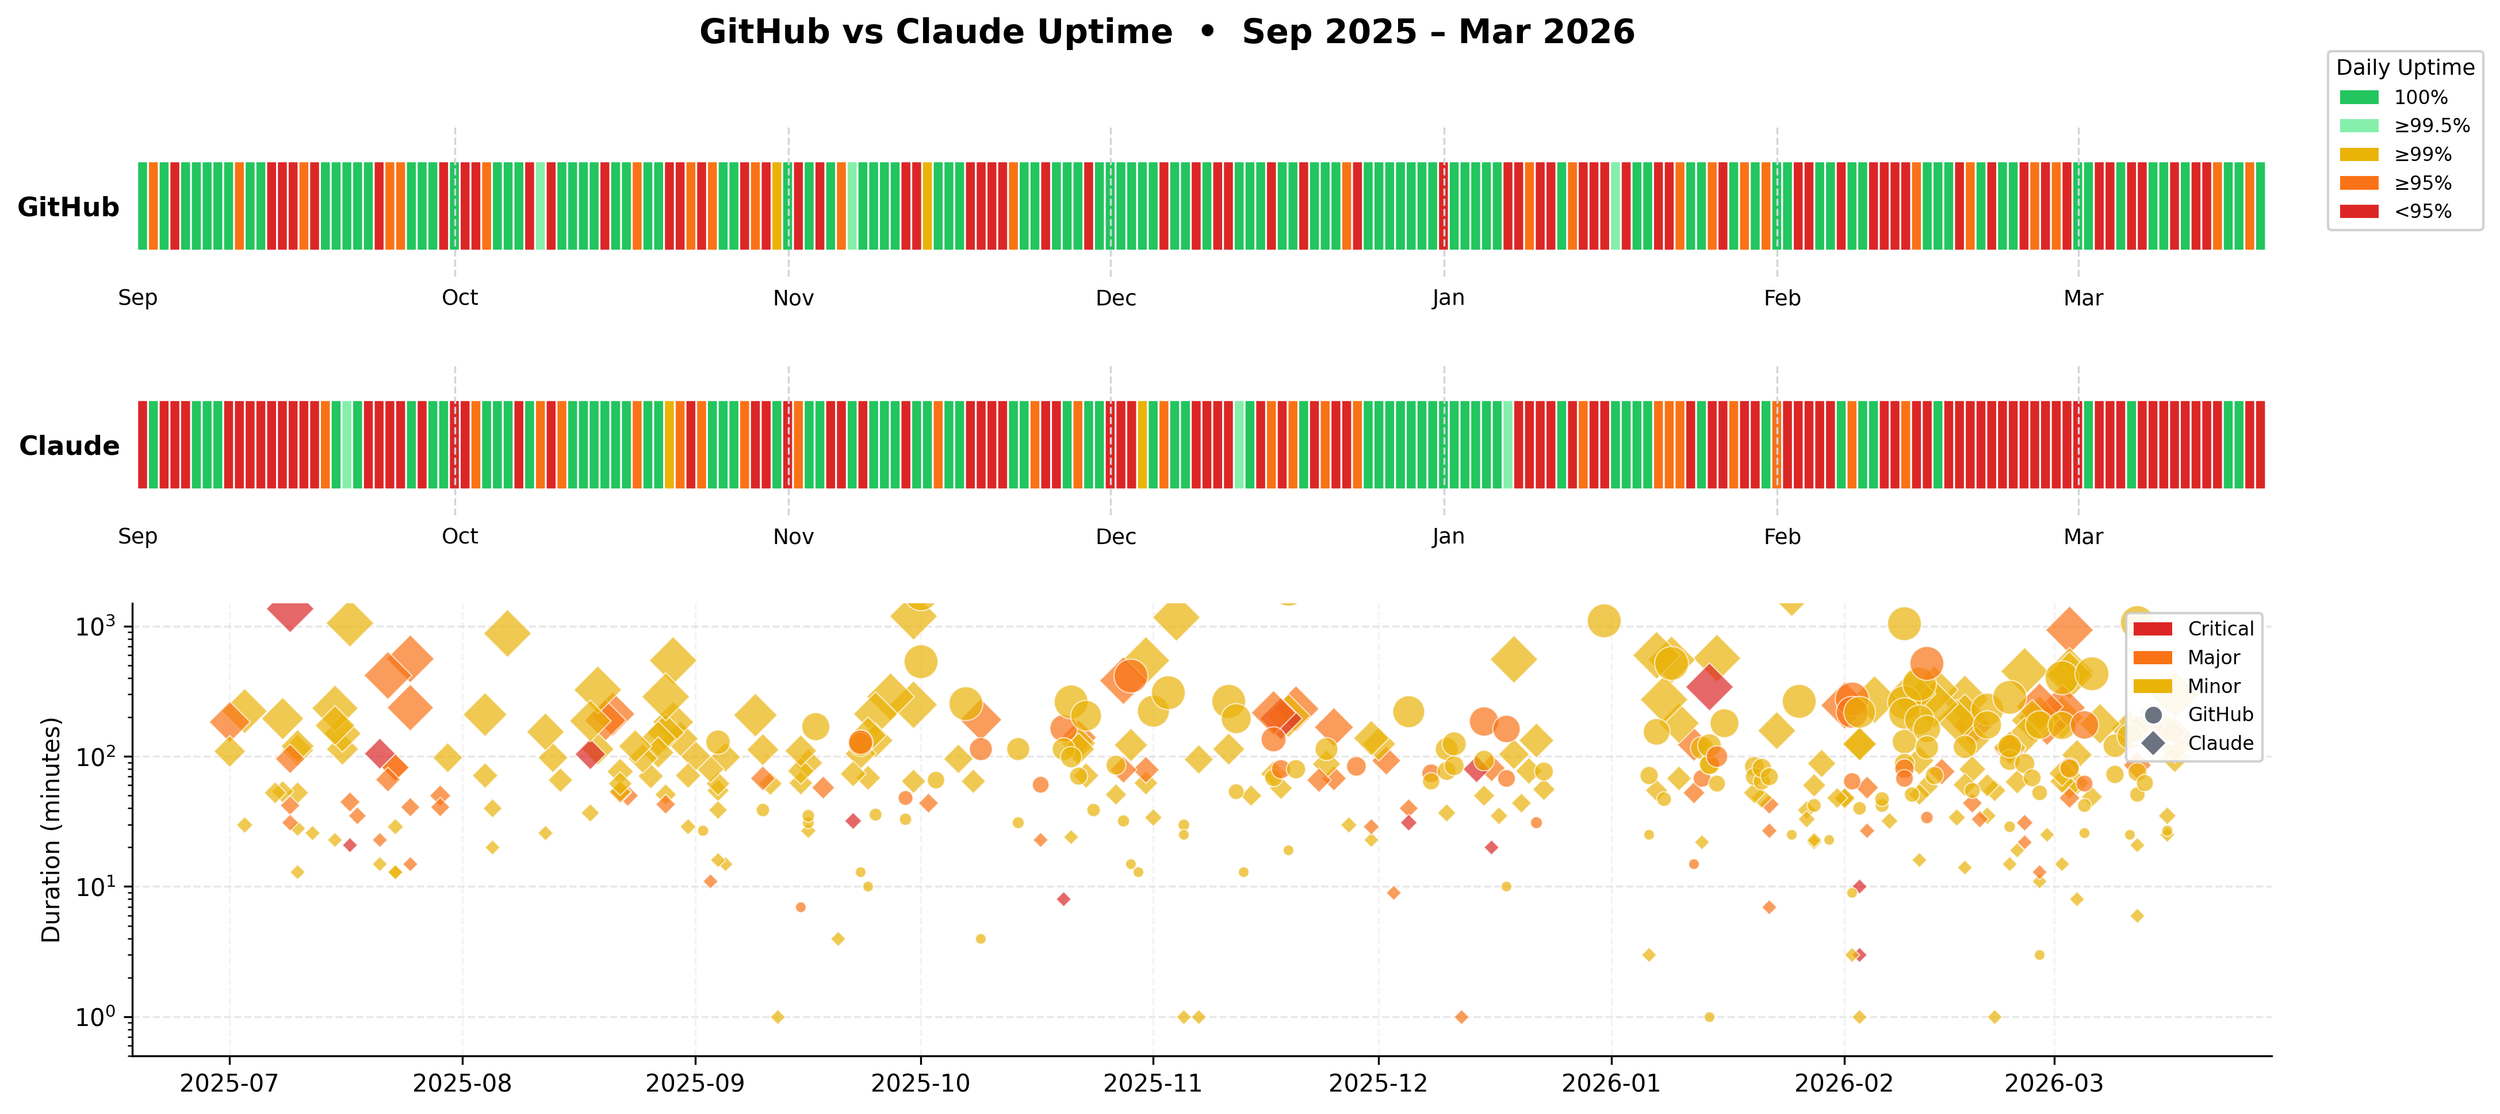
Is downtime related?
I ran the correlation between GitHub and Claude daily outage minutes: r = 0.197. A weak correlation. Not great, not terrible.
That was the wrong question.
The severity of outages is uncorrelated: a bad day for GitHub says nothing about how bad Claude's day will be. But when they fail is strikingly similar. Like Khalid and Dove Cameron, they go down together.
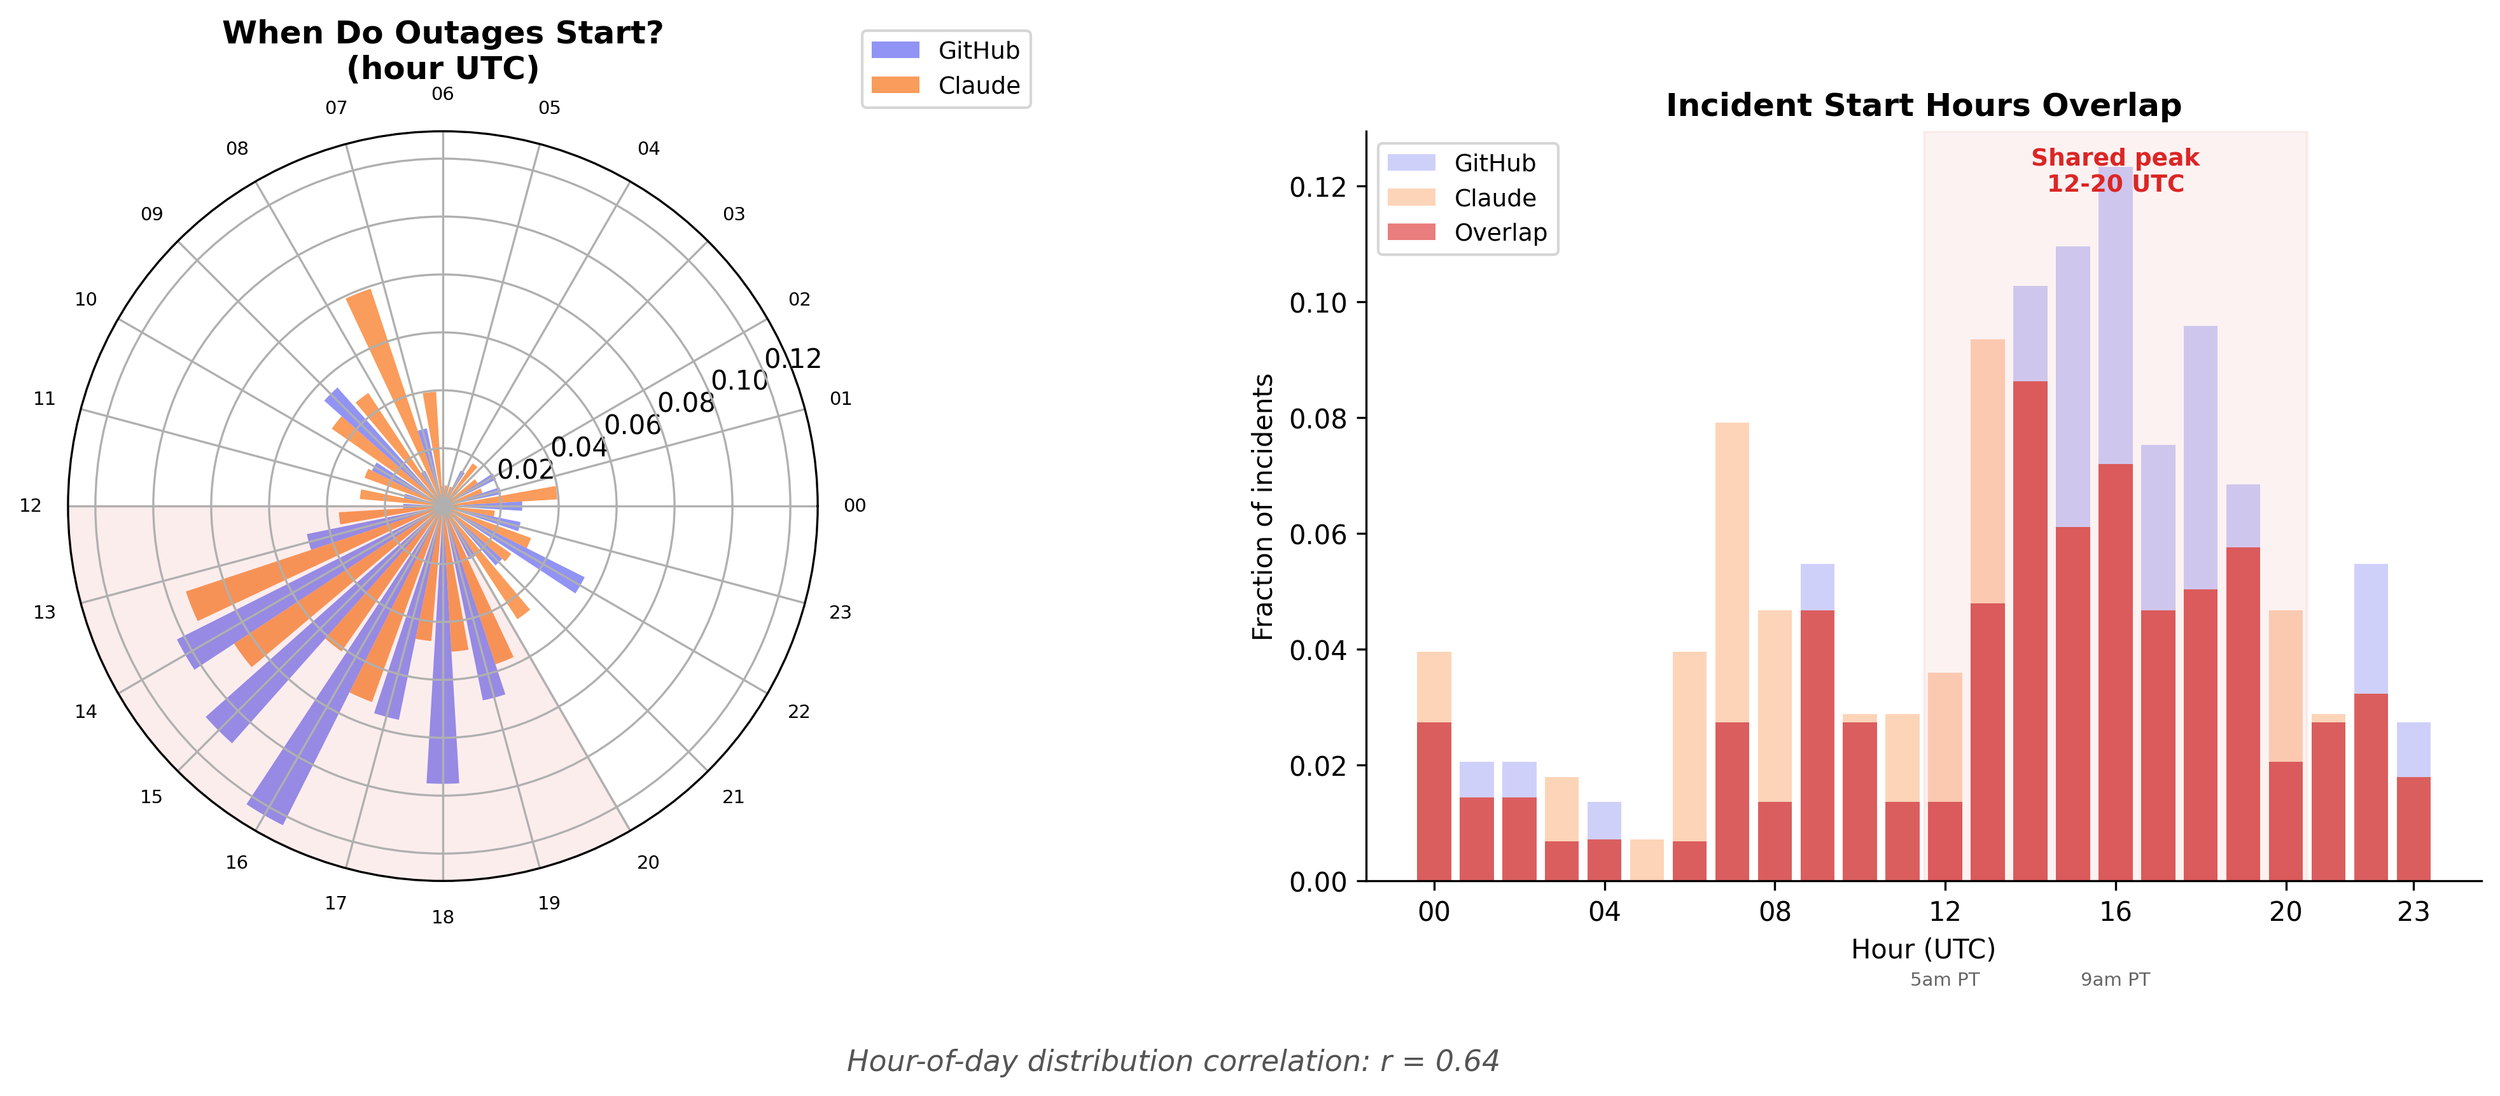
Outages occur together
Both services cluster incidents between 12:00 and 20:00 UTC. Hour-of-day correlation: r = 0.64.
Deployments happen during the workday. Traffic spikes during the workday. The humans who push the code that causes the incidents are mostly in US time zones. So all that load concentrates, and then, boom, outages. Unfortunately, outages when you're trying to work and use these services.
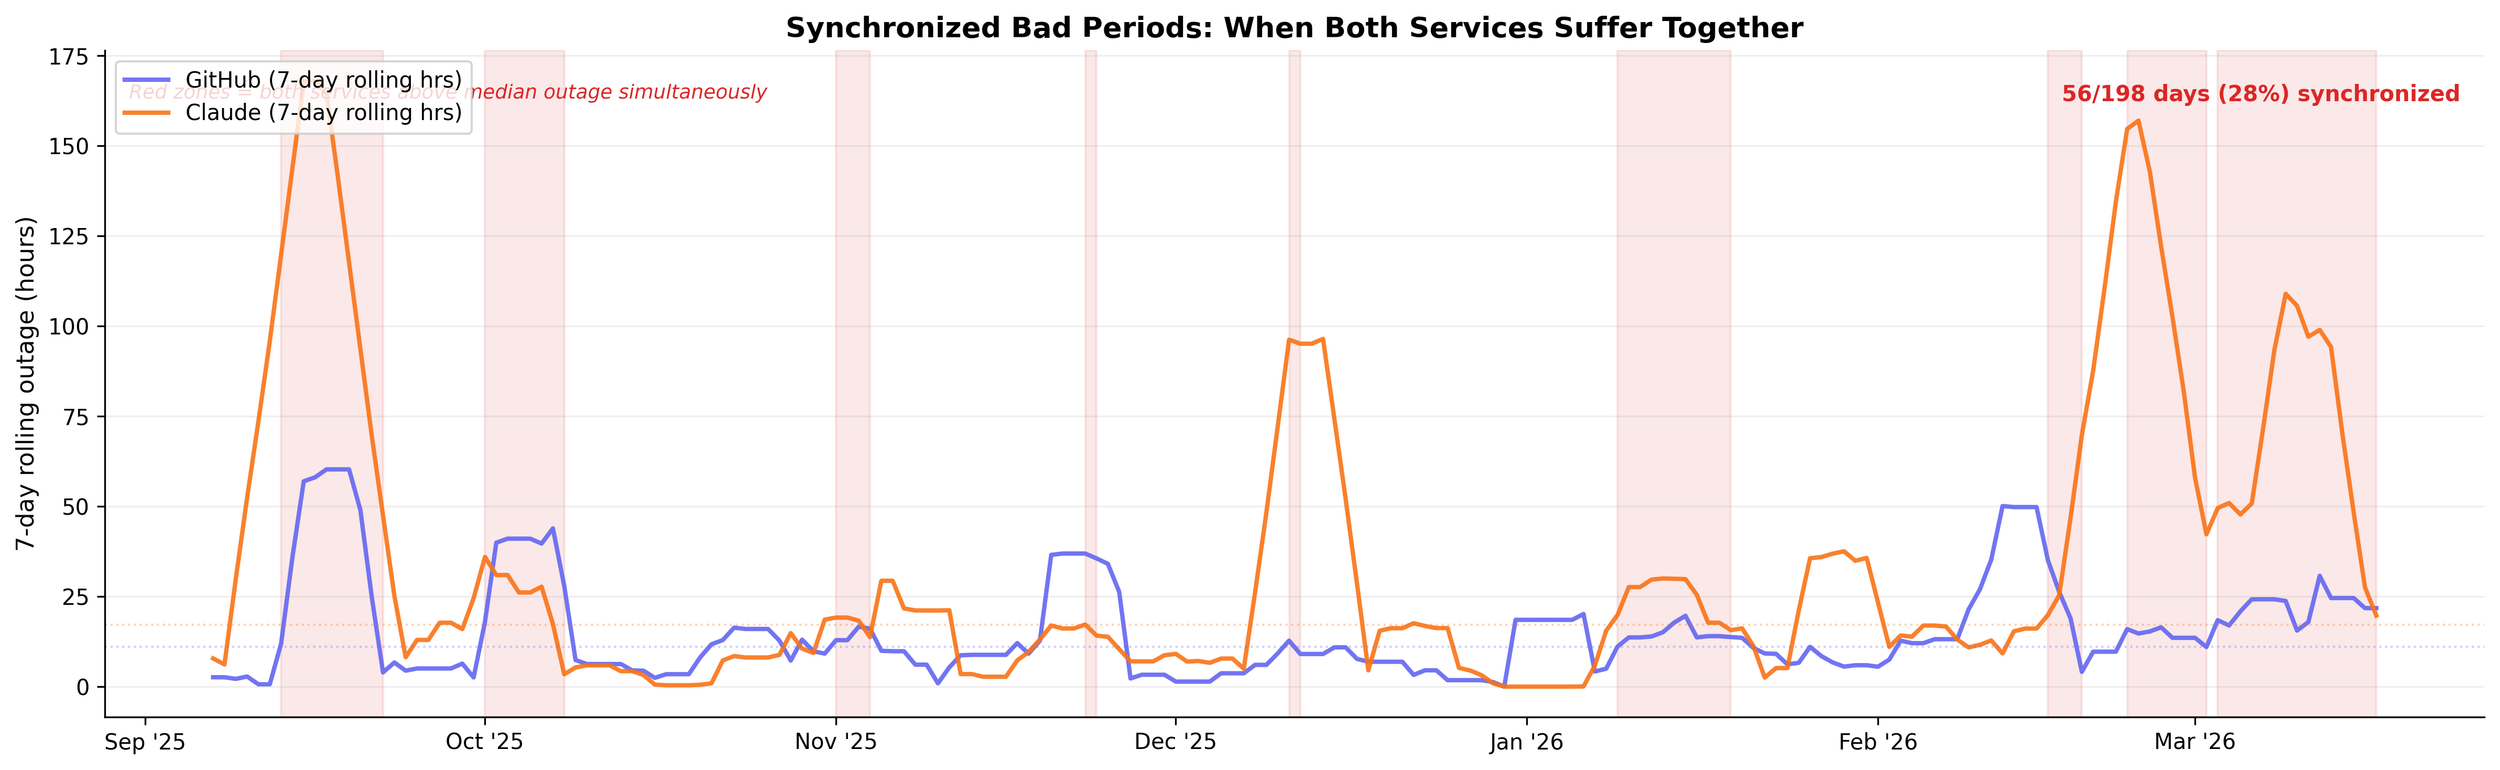
Contagion
When GitHub has an incident on day T, the probability that Claude has an incident on day T+1 rises from a 63.1% baseline to 75.8%. The reverse holds: Claude down on day T lifts GitHub's next-day probability from 48.0% to 58.1%.
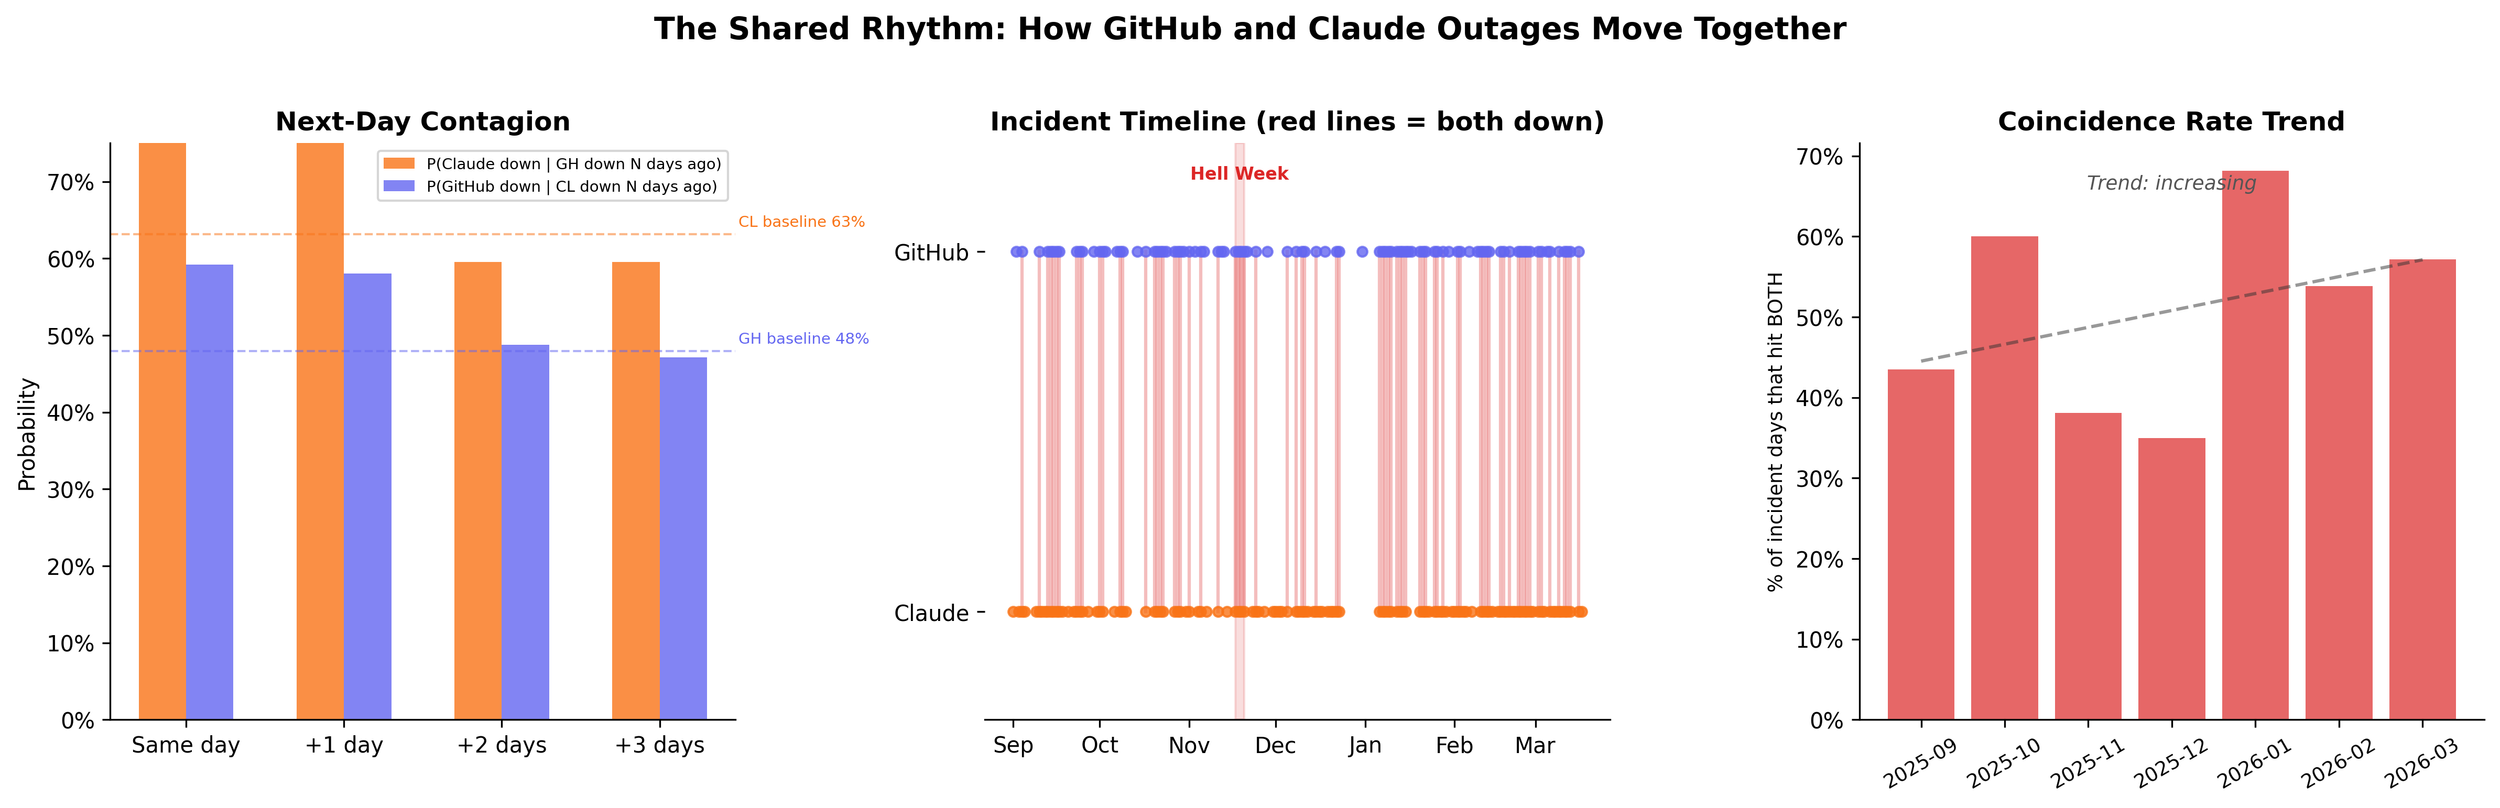
I don't think one service is causing the other to go down. But it's not out of the question.
The coincidence rate has more than doubled. In September 2025, about 23% of days saw both services with incidents. By February-March 2026, that number is above 47%.
Christmas every weekend
From December 24 through January 1, Claude had zero incidents. Not degraded. Not minor. Zero. GitHub had one. Then January 2 hit, and both services returned to their normal cadence immediately.
That holiday window isn't special. It happens every week(end).
GitHub is up 89.3% on weekdays and 96.5% on weekends. Incidents touch 62% of weekdays and 11% of weekends. Claude shows the same pattern: 92.5% weekday, 97.8% weekend. Tuesday through Thursday is the danger zone. Sunday is practically a different service.
These systems don't fail randomly. They fail when engineers are working. A broken system breaks on Christmas too — these ones work fine on Christmas, on Saturdays, at 3 AM. They buckle on Tuesday afternoon.
What this means
The coincidence rate — days both were down — climbed from 23% in September to 47% in March. It's not random. It's because they're winning.
GitHub and Claude are the default stack for agentic development. Every team that adopts AI-assisted coding adds load to both services in the same business-hours window.
The adoption wave won't wait for the infrastructure to catch up. Nobody's going back to writing code by hand because Claude was down on a Tuesday.
Methodology
What counts as downtime
These numbers are based on self-reported status page data. An incident counts as downtime if the service operator marked it with impact minor, major, or critical. Incidents marked none and scheduled maintenance windows are excluded.
Daily uptime is the fraction of minutes in the day not covered by an active incident: 1 - (outage_minutes / 1440). Overlapping windows are merged before summing. A day with a one-hour incident scores 95.8%. Multi-day incidents count against every calendar day they span.
This means the numbers are a floor, not a ceiling. Status pages are conservative — they get updated after engineers confirm a problem, and they get closed before every affected user recovers. The real degradation window is almost always longer than what's recorded here.
Data sources: mrshu/github-statuses for GitHub downtime windows, https://status.claude.com/history for Claude incidents. Analysis covers September 1, 2025 through March 17, 2026 (198 days).
Aakash Shah is the co-founder of Wyndly, bringing allergy care to all Americans, with humans superpowered by AI. When the infrastructure goes down, care decisions slow down too. It's why his team thinks about these failure patterns constantly. He also has his own Yegge Level 8 Agent Harness.